What Was Your Tax Rate for 2023?
It’s that time of year, when you’ve received most of your tax forms for putting together your 2023 tax return. Yes, you can pass that pile along to your accountant, but aren’t you curious about what you’re really paying in taxes? At a minimum, so you can complain with accuracy?
THE THREE MAIN COMPONENTS OF MOST TAX RETURNS
The whole point of filing a federal tax return is to report your income for the year. But not all income is taxed equally – and some not at all. Some income – like your salary – is taxed more than once.
INVESTMENT INCOME
Most of you will have at least one Form 1099 reporting interest income (from savings accounts), dividends (from investments) and maybe capital gains (from sales of stocks, mutual funds and other securities). Even if YOU didn’t sell anything in your investments, you may still have capital gains from mutual funds, which are mini portfolios of securities. If the mutual fund sold something for a gain or loss during the year, then your share of that is distributed to you and shows up on your 1099. Depending on how long you held the investments that generated dividends or capital gains, the income you received from them could be taxed at favorable rates, possibly as low as 0%.
EARNED INCOME
From there, tax returns will diverge, depending on whether you are still working or retired. If you are still working, the bulk of your income – your salary, bonus, employer stock compensation like RSUs that vest is earned income and it shows up on your Form W-2. As such, it’s taxed as ordinary income. Ordinary income is subject to the highest tax brackets for federal tax. There is no question that our tax system is tilted to favor investment income over earned income, investors over workers.
Some income whose original source was earned income, like a pension (paid for through your employer), and distributions from employer retirement plan accounts like 401k, 403bs and some IRAs, is also taxed like a salary, as ordinary income.
OTHER TAXES ON INCOME
Lastly, your tax return might be calculating more than just federal income tax. If you’re working for a living, your income is subject to payroll taxes as well as income tax. Payroll taxes are what we pay into Social Security and Medicare for benefits when we retire. As an employee, your employer pays half of your payroll taxes and you pay the other half, which is withheld from your pay and sent to the US Treasury. (If you want to see the details, look at Box 4 on your W-2 to see the tax you paid into Social Security and Box 6 to see what you paid into Medicare.)
Social Security tax is 12.4% of your salary or wages until this income reaches $160,200 for 2023 ($168,200 in 2024). As an employee, you pay half of this – 6.2% – up to a maximum of $9,932.40 for 2023. Note that while the Social Security rate of 6.2% hasn’t changed since 1990[1], the amount of income it is applied to has (in 1990 the base rate it was applied to was $51,300 – about one-third of what it is today).
If YOU are the source of this income – you are self-employed – you’ll pay tax on this ordinary income and you also pay payroll taxes at the full 12.4% rate, so a maximum of $19,864.80 for 2023. Self-employed people – whether full-time or in a side hustle or hobby that makes money – pay both halves of the payroll tax: one half as an employee and the other half as an employer.
Where self-employed taxpayers often struggle is if they don’t make any payments of estimated tax along the way (these estimated payments would include both federal income tax and payroll taxes – they all go into the same kitty). Then when compiling their tax return for the year, they can end up short, owing not only what’s due for federal tax (and state and local if those apply), but also for payroll taxes on their earned income.
Note that not all income from work or investments fits neatly into a 1099 or a W-2. If you are part of a partnership for work or investment purposes, a K-1 reports your income from it. Forms 1099 and W-2 are required to be sent to the taxpayer by January 31st. K-1s are issued after the partnership return is done and won’t likely be available by the April 15th deadline. (But AI might change this – stay tuned!) So file that extension!
THE TAX ON WORK
The preferential treatment that investment income can receive – owing 15% on investment income that might be taxed at 24% if it was salary – is intended to encourage investment. The way this works in the federal budget is that the preferential rate for investors is considered a tax expenditure for everyone. In other words, that preferential rate is a cost for all Americans, BUT you could say investors are paying their “fair share” in tax because this lower tax rate increases investment in the economy. We all enjoy a stronger economy, so subsidizing an investor’s tax liability may make sense. Research has not shown this connection, however. According to the Tax Policy Center, almost 95% of the benefit of this part of the tax structure accrues to those making over $200,000, with almost 75% of the benefits accrue to those making over $1 million[2].
Comparing a single person’s taxable income of $100,000 from work to the same level of income from investments receiving preferential rates, you can see the difference in contribution to paying the nation’s bills (i.e. what is paid in taxes):

The Single taxpayer with $100,000 in taxable, tax-preferenced investment income paid about one-third the tax of the person making that much from a job. For the taxpaying investor in this example, the first $44,625 in investment income here was taxed at 0%, the next $55,375 was taxed at 15%. The Employee’s highest rate of tax was 31.65% (24% ordinary income rate + 7.65% payroll tax).
WHO DOESN’T PAY TAXES?
For the most part, the people who don’t pay income tax are those without much income. According to the Tax Policy Center, in 2022 about 60% of non-payers made less than $30,000 and another 28% made between $30,000 and $60,000[3]. With greatly expanded Standard Deductions under the Tax Cuts and Jobs Act of 2017 (TCJA), if as a single taxpayer in 2023 you had taxable income of less than $13,850 and up to $30,700 for a married couple both over age 65, you would have no taxable income. All of it is offset by the standard deduction.
About one-third of the 72 million households that were expected to pay no federal income tax in 2022 were age 65 or older. Many of these most likely have only their Social Security income to report. Another third are families with children, with income low enough to be eligible to claim the Earned Income Tax Credit and most of whom benefit from the Child Tax Credit.
If you’re concerned about getting more people to pay taxes, know that more households will pay income taxes starting in 2026 if the tax provisions for individuals in the TCJA expire as scheduled at the end of 2025.
FIGURING OUT YOUR TAX RATE
Most people have a combination of all of these types of income, even in retirement. If you have a 401k or 403b, some of your salary went into those accounts and gave you a tax break while you were working. Once retired, eventually you’ll be taking that money out, and when it comes out it will be taxed as ordinary income, just like a salary.
Payroll taxes to Social Security also contributed to a retirement benefit, some of which can be taxed in retirement, and at ordinary income tax rates.
Your filing status matters, too. Married couples who file a joint tax return have a different set of tax rates for their income than single taxpayers, both for earned income and for investment income. (There is a lot of hue and cry about the “marriage penalty” of the tax system; in fact, some have pointed out that there is instead a “single surcharge” for unmarried taxpayers. More on this in a future post.)
However you look at it, figuring out your taxes is not a straightforward exercise in part because your income has so many different components, and our tax code favors some types of income over others.
Every year, the folks at The Kitces Report puts together this brilliant chart showing how different levels of income get taxed, depending on what type of income it is under what filing status:
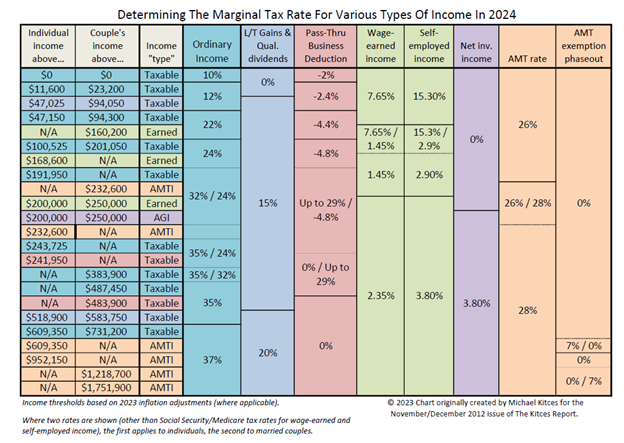
This chart is for 2024, and so far we haven’t touched on some items like Net Investment Income and the parallel tax universe that is the Alternative Minimum Tax (AMT).
ON AVERAGE, WHAT AM I PAYING IN TAXES?
One way to boil down your overall tax rate so you can compare taxes year over year – at least for federal tax purposes – is to look at a single rate. The average tax rate can be defined as the total tax due divided by your total income for the year, before any deductions (Line 24 on your 1040, divided by Line 9). But better still is to look at your effective tax rate:
The effective tax rate is the total tax due divided by your total taxable income for the year, after deductions. (Line 24 on your 1040, divided by Line 15.) This rate takes into account tax strategies and tax shields, like the deductibility of mortgage interest, to illustrate the tax paid on taxable income, and is the rate often used by tax professionals.
If all of this is leaving you even more confused about how your income and effort is taxed, you’re not alone.
It’s not you, it’s the tax code.
[1] In 1950, the Social Security tax increased to 1.5%, and up to 5% by 1978. The current rate went into effect in 1990.
[2] “The Tax Break-Down: Preferential Rates on Capital Gains,” Committee for a Responsible Federal Budget, 08/27/13, retrieved 03/11/2024.
[3] TPC: The Number of Those Who Don’t Pay Federal Income Tax Drops to Pre-Pandemic Levels, Howard Gleckman, 10/27/22, accessed 03/25/24.